

What Natural Language Generation Actually Does
Explains how NLG converts raw financial data into readable narratives without manual writing.
Five things analysts get wrong when first using automation. How to avoid them and get better results faster.

You've just implemented NLG software. The promise was clear: automated narratives that turn spreadsheets into readable reports. But something's off. Your first outputs feel stiff. Numbers aren't flowing into stories the way they should. You're spending almost as much time editing as you would writing from scratch.
Here's the thing — most teams don't fail because the technology doesn't work. They fail because they're using it wrong. We've seen it happen repeatedly. Analysts get frustrated, the tool sits unused, and suddenly management's wondering why they paid for software that's collecting dust. But it doesn't have to be that way. The mistakes are fixable. Most are actually simple once you know what to look for.
This is the biggest one. You can't generate coherent narratives from messy data. If your source data has inconsistencies — missing fields, formatting errors, unclear category names — the NLG system will struggle. It'll produce narratives that don't make sense because the underlying numbers contradict each other.
Before you even plug anything into your NLG tool, spend time cleaning your data. Check for:
Real example: One finance team we worked with had regional sales data where some regions used decimals and others used whole numbers for the same metric. The NLG system couldn't decide if a value of 150 meant 150,000 or 1,500. It took them 3 hours to realize the data needed standardization first. After cleaning, the output was clear.


NLG systems are flexible. Too flexible, sometimes. Many teams skip right past the configuration options and just hit "generate." That's like showing up to a presentation without knowing your audience. You'll get output, sure. But it won't match your reporting style or your audience's expectations.
Most NLG platforms let you customize:
One analyst told us she was getting narratives written in academic style when her board wanted straightforward summaries. It wasn't the tool's fault — she'd just never looked at the tone settings. Five minutes of configuration changed everything.
Important Note: This article is educational and informational in nature. NLG systems work best when paired with human oversight. While automation can significantly speed up your reporting process, final reports should always be reviewed by qualified analysts before distribution to stakeholders. Results vary based on data quality, configuration, and your specific reporting requirements.
Context is everything. Your NLG system doesn't know that this quarter was unusual because of a merger. It doesn't understand that a 15% dip in one metric is actually good news because you were planning for it. Without context, the algorithm sees the numbers and creates a narrative based purely on the data.
Feed your NLG system contextual information:
Without context, an NLG system might write: "Revenue declined 8% this quarter." With context, it can write: "Revenue declined 8% as planned during our transition period, though customer acquisition remained stable at 12% growth." The second tells a story. The first creates unnecessary concern.


This is where many teams drop the ball. They generate a report and send it out without any human review. NLG isn't magic. It's a tool that needs editing, fact-checking, and refinement. Even the best systems produce narratives that benefit from a human touch.
You're not hiring NLG to replace writers. You're hiring it to do the heavy lifting — to take raw data and create first drafts that are 80% of the way there. Your job is to handle the last 20%. That means:
Build review time into your workflow. Don't expect to save 10 hours by cutting all writing time — expect to save 4-5 hours by automating the structural work while keeping the quality control. It's faster than writing from scratch, but it's not zero-effort.
You implemented NLG. Now what? Most teams never measure whether it's actually working. They don't track time saved, report quality, or stakeholder satisfaction. Without metrics, you can't tell if the tool is delivering value or just creating work.
Start tracking these after implementation:
One team we worked with discovered that their system was generating reports 40% faster, but the reports still needed heavy editing. That insight helped them understand they needed better data cleaning (back to mistake 1!) rather than a different tool. Measurement revealed the real problem.

None of these mistakes are about NLG being broken or ineffective. They're about misalignment between expectations and reality. You're implementing a tool that's genuinely powerful, but like any tool, it requires understanding and care.
Clean data, thoughtful configuration, clear context, human review, and measurement. That's the formula. Do those five things right, and you'll see NLG transform your reporting process from a bottleneck into an actual advantage. You'll spend less time on mechanics and more time on insights. Your reports will be faster, more consistent, and actually better.
The teams that win with NLG aren't the ones who treat it as a replacement for writers. They're the ones who treat it as a collaborator. Let the system handle the structure. You handle the story. That's when everything clicks.

Editorial Team
Written by the Narrative Pulse editorial team, focused on practical guidance for automated narrative writing in quarterly reporting.
Explains how NLG converts raw financial data into readable narratives without manual writing.
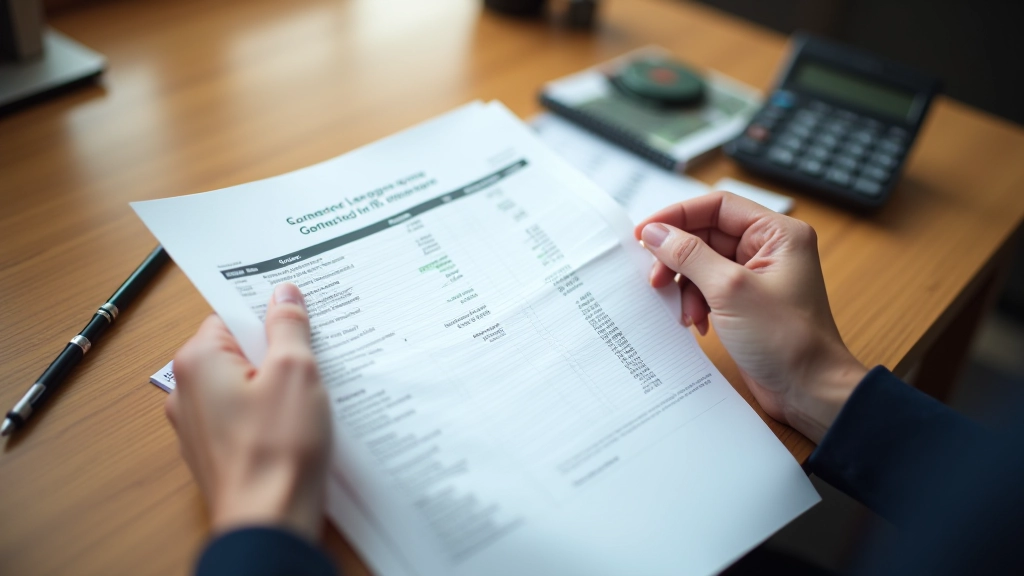
Step-by-step walkthrough of connecting data sources and generating your first automated report.
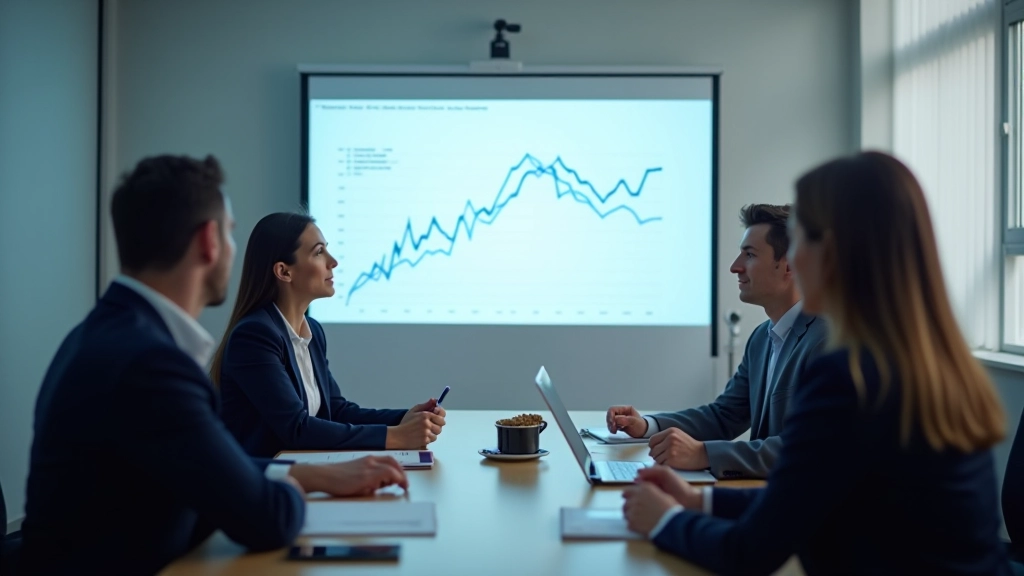
Real timeline comparison. See how automation cuts reporting time from weeks to days.